 The interactive visualization can be found here. Information on the project can be found here. A newer (though less dramatic) version of the visualization can be found here.
-->

Friday, April 9, 2010
Visualization Feature: Geneology of Influence
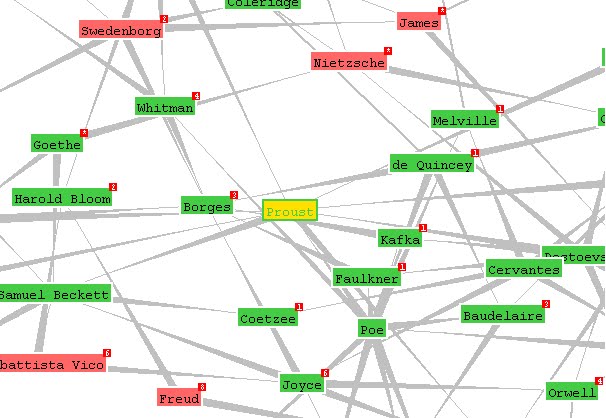
Mike Love created an amazing visualization of philosophical influences using a program called Graphviz. The program gets its data from an open source tool called Freebase. Love started inputting information in Freebase in 2005. At the time of writing, it continues to be updated by other users. The visualization begins with Plato influencing Aristotle and explodes into an extensive mapping of influences. Here's a snapshot of the program:
 The interactive visualization can be found here. Information on the project can be found here. A newer (though less dramatic) version of the visualization can be found here.

The Evolution of Data Visualization
Data visualization is the fastest growing aspect of data blogging (based on informal and super scientific method of “Googling”). Why this is the case is up to debate. Perhaps it is due to the straightforward nature of data visualization: almost anyone can look at a graph and decipher its content. Or perhaps this is due to the technological revolution making it easier (via open source, etc.) to share and create new forms of visualization.
One way we could understand the popularity of data visualization is by tracing its history. I find the work of Michael Friendly and Daniel J. Denis to be the most comprehensive in cataloging milestones in data visualization. Their website is called Milestones in the History of Thematic Cartography, Statistical Graphics, and Data Visualization. Their work involves breaking down each milestone in an interactive timeline. Friendly also has a paper by the same name, which is worth the read if you are interested in this topic.
There are some interesting stuff on the site, such as the first star chart (pictured below) and the hysterical best/worst data visualizations.
 Perhaps the first graph to chart stars and planets (circa 950 BCE)
More importantly however is Friendly’s take on the different eras of visualization. He described the 1850-1899 period as the golden age of data visualization:
“By the mid-1800s, all the conditions for the rapid growth of visualization had been established. Official state statistical offices were established [throughout] Europe, in recognition of the growing importance of numerical information for social planning, industrialization, commerce, and transportation. Statistical theory, initiated by Gauss and Laplace, and extended to the social realm by Guerry [114] and Quetelet [244], provided the means to make sense of large bodies of data.” (Friendly 18)
Conversely, the mid-1930s is described as the “modern dark ages” of data visualization:
“There were few graphical innovations, and, by the mid-1930s, the enthusiasm for visualization which characterized the late 1800s had been supplanted by the rise of quantification and formal, often statistical, models in the social sciences. Numbers, parameter estimates, and, especially, standard errors were precise. Pictures were—well, just pictures: pretty or evocative, perhaps, but incapable of stating a “fact” to three or more decimals. Or so it seemed to statisticians.” (Friendly 27)
What about today? According to Friendly, the period that we’re living in now is known as the “High-D data visualization” era. This period is characterized by accelerated and varied visualization processes mainly due to technological advancement. We should note that there have not been many innovations from the 2000s.
When we place data in context of time, we can see why data visualization remains to be the most popular type of data site out there: We are in a period of awakening from the data dark ages. This movement reflects our own mission to improve historical data access to the public and our use of tools such as GIS data mapping to push the boundaries of visualization.
One way we could understand the popularity of data visualization is by tracing its history. I find the work of Michael Friendly and Daniel J. Denis to be the most comprehensive in cataloging milestones in data visualization. Their website is called Milestones in the History of Thematic Cartography, Statistical Graphics, and Data Visualization. Their work involves breaking down each milestone in an interactive timeline. Friendly also has a paper by the same name, which is worth the read if you are interested in this topic.
There are some interesting stuff on the site, such as the first star chart (pictured below) and the hysterical best/worst data visualizations.
 Perhaps the first graph to chart stars and planets (circa 950 BCE)
“By the mid-1800s, all the conditions for the rapid growth of visualization had been established. Official state statistical offices were established [throughout] Europe, in recognition of the growing importance of numerical information for social planning, industrialization, commerce, and transportation. Statistical theory, initiated by Gauss and Laplace, and extended to the social realm by Guerry [114] and Quetelet [244], provided the means to make sense of large bodies of data.” (Friendly 18)
Conversely, the mid-1930s is described as the “modern dark ages” of data visualization:
“There were few graphical innovations, and, by the mid-1930s, the enthusiasm for visualization which characterized the late 1800s had been supplanted by the rise of quantification and formal, often statistical, models in the social sciences. Numbers, parameter estimates, and, especially, standard errors were precise. Pictures were—well, just pictures: pretty or evocative, perhaps, but incapable of stating a “fact” to three or more decimals. Or so it seemed to statisticians.” (Friendly 27)
What about today? According to Friendly, the period that we’re living in now is known as the “High-D data visualization” era. This period is characterized by accelerated and varied visualization processes mainly due to technological advancement. We should note that there have not been many innovations from the 2000s.
When we place data in context of time, we can see why data visualization remains to be the most popular type of data site out there: We are in a period of awakening from the data dark ages. This movement reflects our own mission to improve historical data access to the public and our use of tools such as GIS data mapping to push the boundaries of visualization.
Thursday, April 8, 2010
Visualizing Empires Decline
Data visualization tend to rely on contemporary data. However, Pedro M Cruz has shown that visualization can work with historical data as well in his piece "Visualizing Empires Decline" (the video below might be too small to see, so click on the above link instead).
Data Sets & Data Portals: What Are They and Why Do They Matter?
One of the components for the Dataverse Project is the compilation of external links. These links can be grouped into two main categories: data sets and data portals.
We make this distinction because data set sites are sites that houses data itself, while data portals point toward other sites that house the data (in a way then our Dataverse project is a portal to other portals).
Below are some frequently asked questions (and their corresponding answers) that I get when I talk to people about this project:
What’s the point?
The main goal of the Dataverse Project is a creation of a comprehensive, long term, world historical database. By gathering external data sources:
There were some discussions going back and forth as to what we should name these sites that we were collecting. At the end of the day we used our own logic, instead of naming conventions to name the data we have collected. We did this because there were no naming conventions to speak of. For example, what we call data portal is also known as data warehouse, gateway, clearinghouse, etc. Though someone could technically describe the difference between these naming conventions, the difference between them is small and so calling something as encompassing as a portal would meet our need.
We divided them into two categories of data, but in all honesty, there were sites that do not conform to each individual description. For example, there are sites that provide data sets and data portals (similar to our Dataverse Project), but they were few and far between and we found no justification to create a new category for these sites (for now).
How do we display them?
Currently, it’s set up as a bunch of links on two web pages.
How would we like to display them?
What we hope to do going forward includes separation of portal/sets by categories/discipline, region and timeline. Adding metadata/tags to individual data sites would be the subsequent step. This tagging capability gives users the ability to extract data sites based on naming conventions that go beyond categories, region and timeline. Tagging could be done by users (tags) and/or added by staff (metadata).
There are many sites that already implement our proposed categorization techniques. We will be featuring them on our blog in the future.
What are some of the issues we face?
Besides naming conventions and lack of data display options, another issue that we ran into is attribution. We did not want to give an impression that these sites belong to us, so we explicitly make users agree that the information they are obtaining are from a third-party site, that we are merely a conduit of these data. There are also not one universal set of rules for data usage for these sites, thus we made it clear that usage is preconditioned upon the terms that each website has set.
There are also issues of viruses and expired links. We make the best effort in avoiding sites that do pose these problems. We run virus scans on a sample of files in the sites and we routinely check for broken links, to give users the best browsing experience. That said, we still included a disclaimer that we cannot guarantee virus-free links.
We are also having issues naming the external sites. At the time of writing, they are alphabetically arranged based on our description of the site. We are addressing this issue by providing a search link, but a naming convention has to be established to improve the functionability of our website.
What else can we do to improve the external links section?
As of now, I can’t think of any beyond what has already been said. I sincerely hope that you can provide some feed back on our website. We’re new and we’re willing to listen.
We make this distinction because data set sites are sites that houses data itself, while data portals point toward other sites that house the data (in a way then our Dataverse project is a portal to other portals).
Below are some frequently asked questions (and their corresponding answers) that I get when I talk to people about this project:
What’s the point?
The main goal of the Dataverse Project is a creation of a comprehensive, long term, world historical database. By gathering external data sources:
- We are identifying potential collaborators that we hope would contribute relevant data to this objective.
- We are informally gauging the availability of long term historical data.
- We are providing an auxiliary resource of data for people who visit our website.
- We are analyzing new innovations from data collectors.
There were some discussions going back and forth as to what we should name these sites that we were collecting. At the end of the day we used our own logic, instead of naming conventions to name the data we have collected. We did this because there were no naming conventions to speak of. For example, what we call data portal is also known as data warehouse, gateway, clearinghouse, etc. Though someone could technically describe the difference between these naming conventions, the difference between them is small and so calling something as encompassing as a portal would meet our need.
We divided them into two categories of data, but in all honesty, there were sites that do not conform to each individual description. For example, there are sites that provide data sets and data portals (similar to our Dataverse Project), but they were few and far between and we found no justification to create a new category for these sites (for now).
How do we display them?
Currently, it’s set up as a bunch of links on two web pages.
How would we like to display them?
What we hope to do going forward includes separation of portal/sets by categories/discipline, region and timeline. Adding metadata/tags to individual data sites would be the subsequent step. This tagging capability gives users the ability to extract data sites based on naming conventions that go beyond categories, region and timeline. Tagging could be done by users (tags) and/or added by staff (metadata).
There are many sites that already implement our proposed categorization techniques. We will be featuring them on our blog in the future.
What are some of the issues we face?
Besides naming conventions and lack of data display options, another issue that we ran into is attribution. We did not want to give an impression that these sites belong to us, so we explicitly make users agree that the information they are obtaining are from a third-party site, that we are merely a conduit of these data. There are also not one universal set of rules for data usage for these sites, thus we made it clear that usage is preconditioned upon the terms that each website has set.
There are also issues of viruses and expired links. We make the best effort in avoiding sites that do pose these problems. We run virus scans on a sample of files in the sites and we routinely check for broken links, to give users the best browsing experience. That said, we still included a disclaimer that we cannot guarantee virus-free links.
We are also having issues naming the external sites. At the time of writing, they are alphabetically arranged based on our description of the site. We are addressing this issue by providing a search link, but a naming convention has to be established to improve the functionability of our website.
What else can we do to improve the external links section?
As of now, I can’t think of any beyond what has already been said. I sincerely hope that you can provide some feed back on our website. We’re new and we’re willing to listen.
Other Data Blogs
A simple Google search of the term “Data Blog” results in 148,000 hits.
Conclusion: what we’re attempting is nothing new. However, compared to a search of “News Blog” (20.9 million hits) or “Sports Blog” (8.6 million hits), data blogging has yet to take flight (assuming that it will).
So data blogging is actually in a strange place where only a few have taken the lead yet the level is nothing compared to other forms of blogging. The first order of business then, is to see what these select few are up to.
Through simple Google research here are some key findings for data blogs:
Conclusion: what we’re attempting is nothing new. However, compared to a search of “News Blog” (20.9 million hits) or “Sports Blog” (8.6 million hits), data blogging has yet to take flight (assuming that it will).
So data blogging is actually in a strange place where only a few have taken the lead yet the level is nothing compared to other forms of blogging. The first order of business then, is to see what these select few are up to.
Through simple Google research here are some key findings for data blogs:
- Data blogs are predominantly blogs on data visualizations. To me, this makes sense because people are trying to find new ways to display data and go beyond the ubiquitous scatter plots and pie charts. Also, since people are visual animals, this topic is able to attract more traffic, than say, the folks who write about data mining, making it more profitable and pervasive.
- These data display sites come in three different forms:
(a) Sites that provide tools to display data
(b) Sites that display interesting data
(c) Sites that discuss data visualization - Many of the data blogs that features interesting data are concerned with showcasing contemporary data. The Guardian has an excellent one called the Data Blog.
- There are virtually no sites that are blogging exclusively about historical data and its implications (aka what we’re doing). Hooray! There are, however, historical blogs and data blogs that occasionally write about history, though none are completely devoted to historical data. Note: there are also insanely interesting blogs about the history of data.
- Then you have really esoteric sites writing about data mining, data storage, legality of data, etc.
- In general, there are two types of sites out there: sites that archive and sites that point to these archives. The Dataverse Project does both.
- The Dataverse site is far from perfect. There are sites that are the models for categorization (spatial, temporal, by discipline), sites that are models for archiving, and sites that are models for data attribution that we can learn from.
- There are also sites that provide space to archive. One famous one is the Dataverse Network Project (not to be confused with our World-Historical Dataverse), run by the folks at Harvard.
- Finally, you have sites that are in my dreams: sites that do not exist[s], that I wish had existed. These include blogs on the nature of data, on data software, on open source data, etc.
Welcome to the Dataverse Blog
The Dataverse Blog is a space where we will discuss data ideas and data issues. These include, but are not limited to, data mining, data visualization, data archiving, data attribution, and data storage. An emphasis would be given to historical data, although this does not preclude us from showcasing contemporary ideas that may benefit historians.
We want this blog to be a companion site to our Dataverse Project, so that users can see what goes behind the scenes of our day-to-day activities. More importantly it’s a good way to show you how we reach certain decisions on data issues we’ve encountered along the way. The blog also serves as a place where we will feature best practice sites, from a myriad of disciplines, for the benefit of anyone working on similar projects.
Subscribe to:
Posts (Atom)